
Our engineering team at Iterable strives to enable marketers to deliver high quality customer experiences at scale. Releasing updates and new features without any failures (such as service impairment or outage) is an essential part in accomplishing this goal, and the Change Failure Rate of the DORA metrics helps us measure this.
DevOps Research and Assessment (DORA) metrics refer to the four key metrics that DevOps teams use to measure performance of delivery practice of an organization. They are deployment frequency (DF), lead time for changes (LT), mean time to recovery (MTTR), and change failure rate (CFR).
Why We Integrated Jellyfish
Change Failure Rate is the percentage of deployments that result in degraded services in production. Calculating this metric is simple—take the number of failures and divide them by the total number of deployments. What is not so simple, though, is getting the total number of deployments—or the Deployment Frequency of the DORA.
This data is usually available in your organization’s pipeline tool, but oftentimes the tool does not come with an out-of-the-box solution for you to automatically retrieve them. Harness, the CI/CD pipeline tool used at Iterable, was no exception. We had this data in Harness, but the only way to pull them was to create a custom dashboard and perform a manual check every month. This was not scalable, nor did we have a centralized place to record the number and analyze the trends.
That’s why we decided to integrate Harness with Jellyfish. Jellyfish provides a way to collect and organize the Deployment Frequency data via a simple POST API endpoint that can be added to each pipeline. The challenge here was that there was no article available that shows us how to implement this step by step. So with the help of our site reliability team and their expertise, we decided to put together one ourselves. In this article we will walk you through the steps we took to integrate Harness with Jellyfish to automatically collect deployment frequency.
How We Integrated Jellyfish
This integration was done in three main steps. First, we built a shell script, then, we configured Harness, and, lastly, we tested and launched.
Building a Shell Script
The core part of the integration was pretty simple: writing a shell script that calls Jellyfish’s deployment POST endpoint. There were a few pieces of information to gather before writing the actual script.
Understanding Jellyfish Requirements
To send data from Harness to Jellyfish, we first needed to store the API key of Jellyfish in Harness. This was done via Secrets Management in Harness UI. (Note: only the users with admin permissions are able to add secrets.) After adding the secret, you can reference the key using the following expression: ${secrets.getValue("secret_name")}
After storing the API key, we took a look at the fields required by the endpoint. Jellyfish lists the minimum API specifications for Deployment POST Endpoint here, namely:
- reference_id (string)
- deployed_at in ISO 8601 datetime string (YYYY-MM-DDThh:mm:ss, in UTC)
- repo_name (string)
- commit_sha or prs (array)
Optional (but useful) fields we decided to use:
- name
- labels
- is_successful
- source_url
Understanding Built-In Harness Variables
To pass those minimum requirements to Jellyfish, we used the built-in Harness variables as much as possible. The following list is what we ended up using. (You can find the full list of built-in variables here.)
- workflow.variables.githash (Used for commit_sha)
- workflow.startTs (Used for generating unique reference_id for each deploy, combined with commit sha)
- service.name (Passed as labels)
- deploymentUrl (Passed as source_url. It provides a direct link to the deploy in the Harness Deployments page)
The Shell Script
After we safely secured the Jellyfish API key, nailed down the requirements, and took Harness variables into account, we had to write the script. Here’s what we landed on, after going through many different variations along the way:
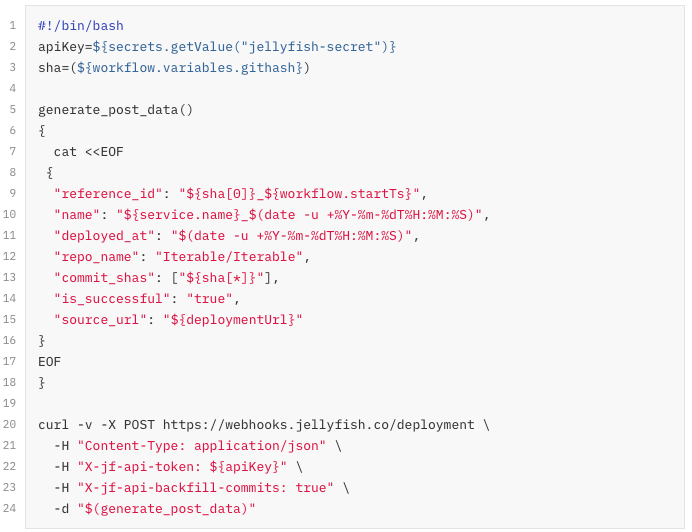
To write this script, we took the sample curl request from Jellyfish and built on it. Since we’re passing more metadata than the sample, we separated out the request payload in its own generate_post_data() definition for easier reading. In addition, we found it easier to declare variables for certain fields like apiKey and sha before passing them into the payload. Doing this also proved to be a better way to simplify the syntax—otherwise the script would be harder to maintain.
Additional Metadata Explained
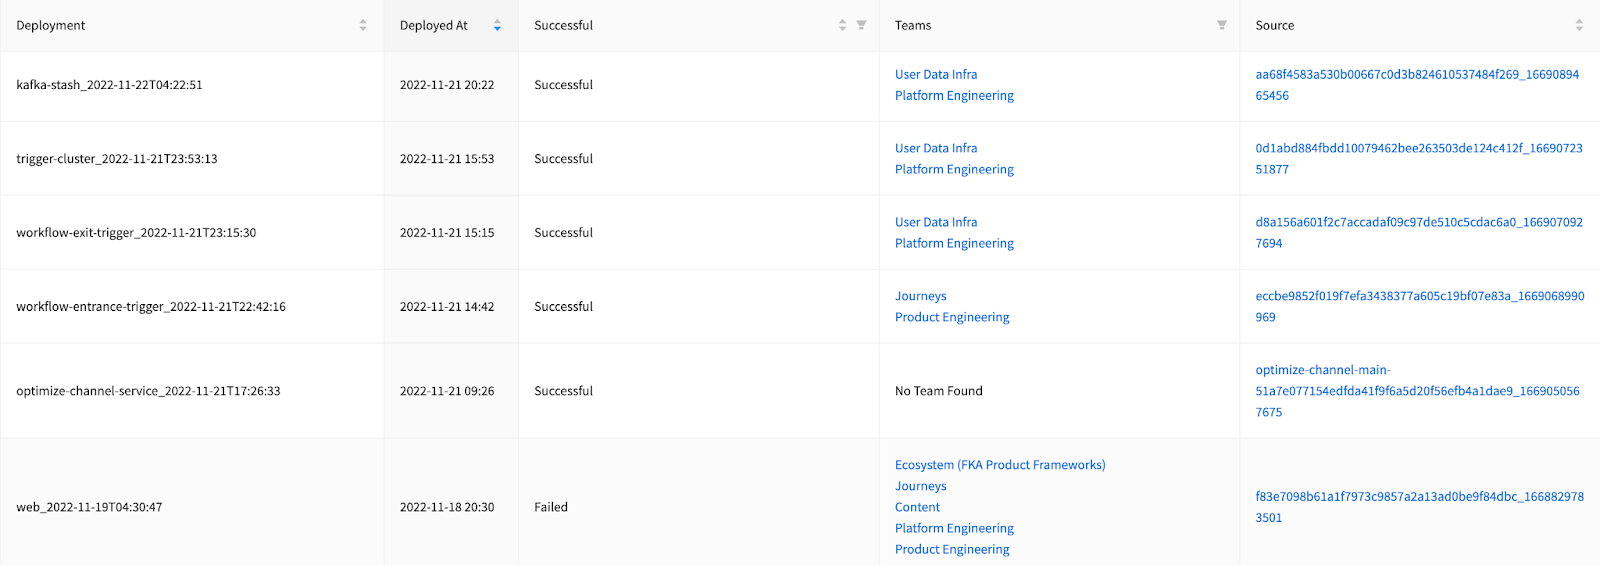
Although the name field is not required, this field is visible in the Jellyfish’s Deployment table (screenshot in the Results section). We wanted this field to be unique enough to identify each deploy and also human readable, hence combined service.name and the deployed_at timestamp.
is_successful and X-jf-api-backfill-commits
is_successful tag was added in to indicate whether a deploy was successful or not (more on this in the Configuring Harness section below). X-jf-api-backfill-commits tag was added to enable Jellyfish’s Commit “backfilling” feature that calculates lead time for changes more accurately. This essentially finds and sends in all the commits associated with each deployment, along with the HEAD commit being deployed. is_successful and X-jf-api-backfill-commits tags are recent additions, and are optional.
Configuring Harness
Once we had a final version of the shell script, we applied it to workflows in Harness. In doing so, we made sure to experiment with our changes on a test workflow—a simplified version of the most frequently used workflow.
Adding the Script in the Right Place
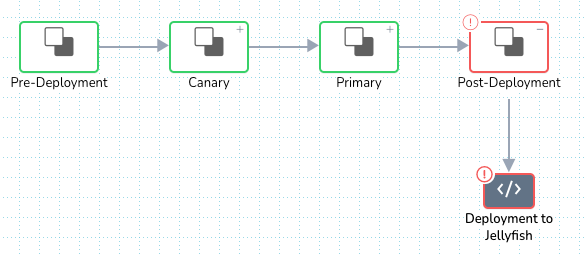
Finding the correct workflow step for the script to run within took some trial and error. At first, we placed the script at the Post-Deployment step. This was most logical at the time, as we only wanted to track and send the deploy data only when the deployment is fully complete, and the Post-Deployment step is the concluding step of the workflow.
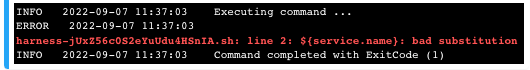
But, that didn’t work quite as expected. It resulted in “a bad substitution” error at pulling in ${service.name} as shown above. As it turns out, at this step of the workflow, ${service.name} variable was no longer in scope to be referenced. This made us move the script to take place earlier in the workflow where the variable is still in scope, right before it reaches the Post-Deployment phase.
And voila! That change resolved the bad substitution error.
Adding an Execution Condition
After we added the script, we wanted to ensure only the production deploy is sent to Jellyfish, and staging deploys aren’t. We did this by setting an execution condition on the script using the ${env.name} variable. If the deployment is for a staging environment, it will skip the script execution.
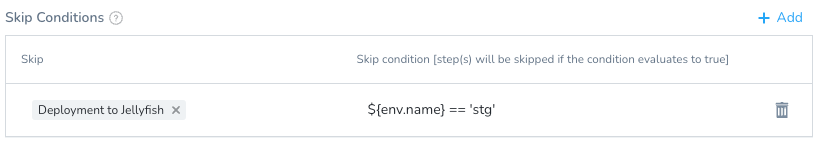
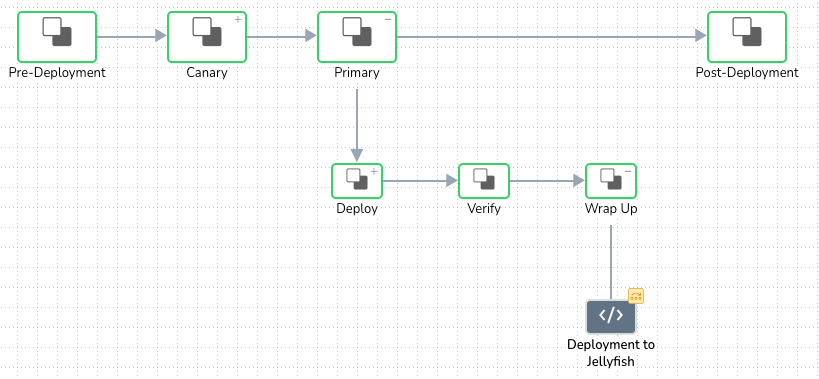
The Deployment to Jellyfish tile with the skip logic (yellow icon):
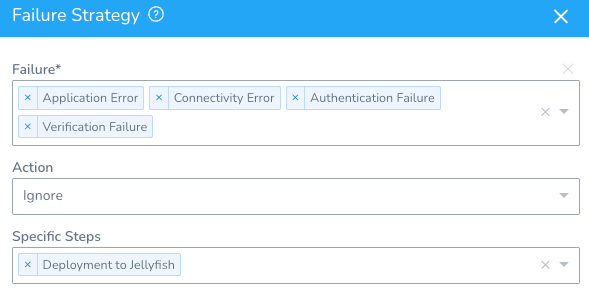
Adding Failure Strategy
One final remaining configuration was Failure Strategy. It was critical for the script step to not interfere with the ongoing deployment in any way, even if it errors out. This was achieved by specifying which type of script failures can be ignored in the workflow.
Repeat for Failed Deployment Scenario
Once the failure strategy was added, we were all set to send successful deployments to Jellyfish. Since we wanted to capture failed deployments as well, we followed the same process above one more time, with a couple of changes.
First, we cloned the script (call it a “failed” version) and replaced is_successful=true with is_successful=false. Jellyfish can filter between successful versus failed deployments based on this tag.
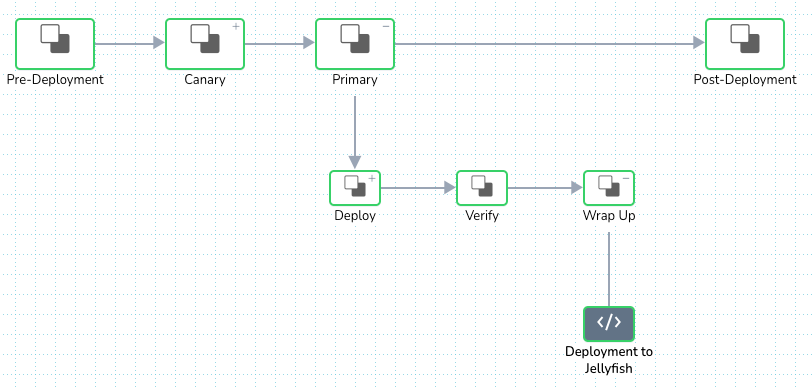
Then, we had to look for the best step for this failed version of the script to run. It wouldn’t make sense to place the script at the same step as successful deploy. Failed deploy takes a rollback route in a workflow, successful deploy doesn’t. This made us choose to place the script at the end of the rollback step.
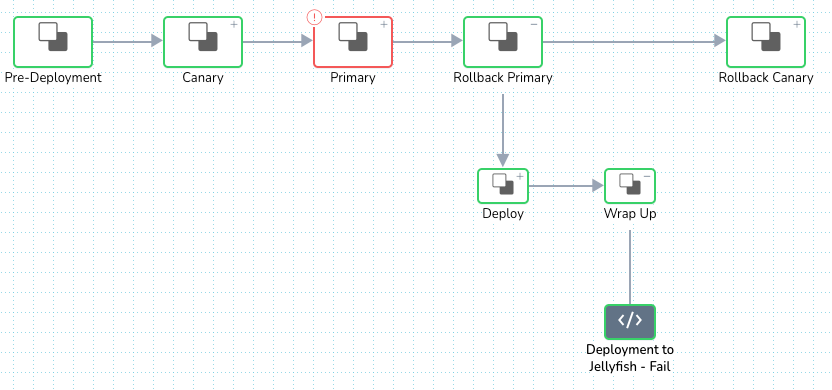
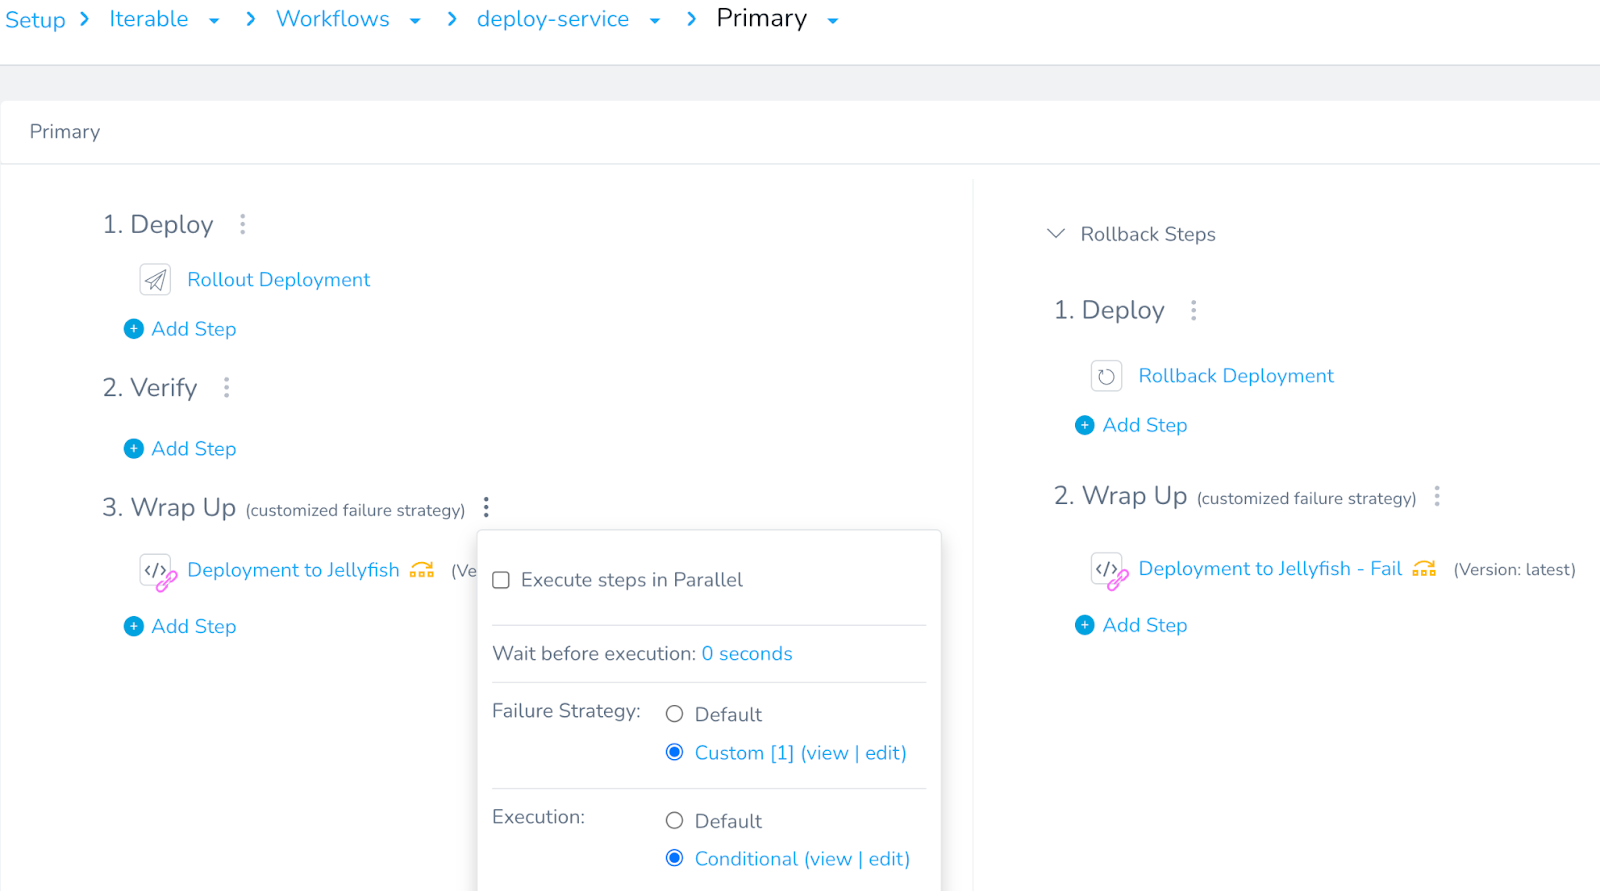
Lastly, the same set of execution conditions and failure strategy was applied. The workflow’s main deploy tile looked something like this at the end:
View of the main deploy tile at the end:
Test and Launch
Testing is our third step in this article, but by no means should you skip testing until later in the project. We recommend running a test deploy with a simplified version of a workflow in each step of the project, making sure to use a non-production environment, dummy service, and build. We were able to catch most errors and mistakes (syntax error, data type mismatch, etc) early on by testing frequently.
Some of the errors we were able to handle include:
- 400 Bad request
- 403 Unauthorized
- Bad substitution
- Failed to parse request data as JSON
- Syntax error
After we verified that our test deploy runs to Jellyfish consistently returned success status, we felt confident and expanded the same script and configuration to all live workflows in Harness.
The Results
We did it! We successfully launched this integration for 11 workflows in total. Below is a sneak peek of our deployments in November 2022 in Jellyfish.
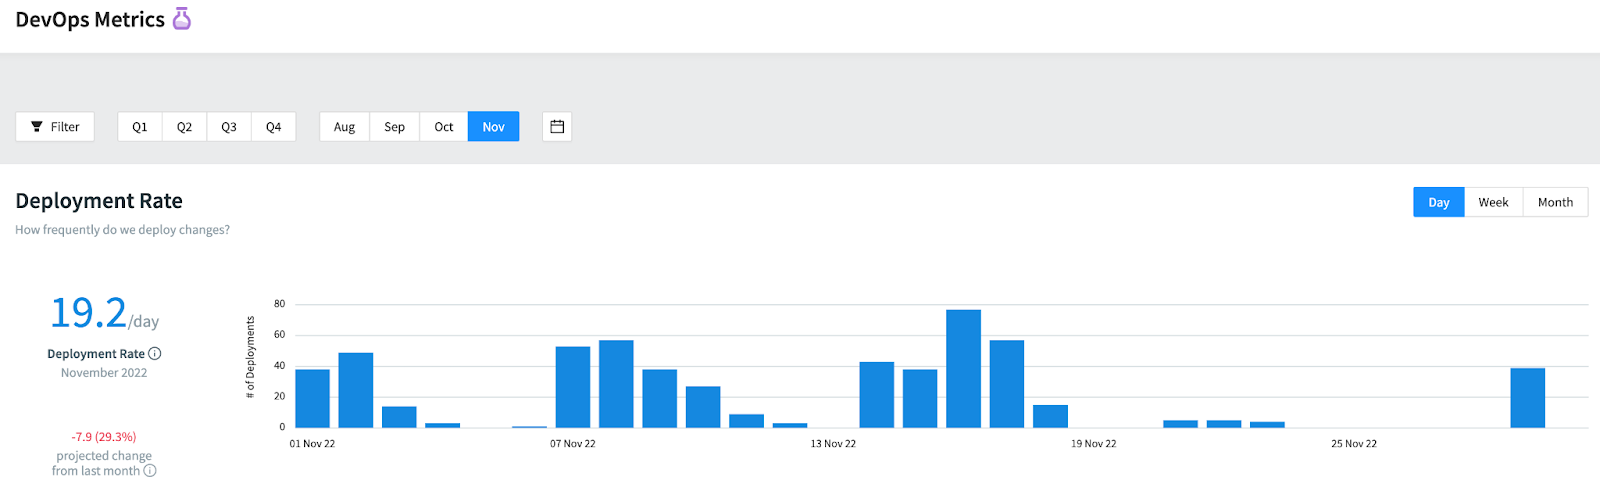
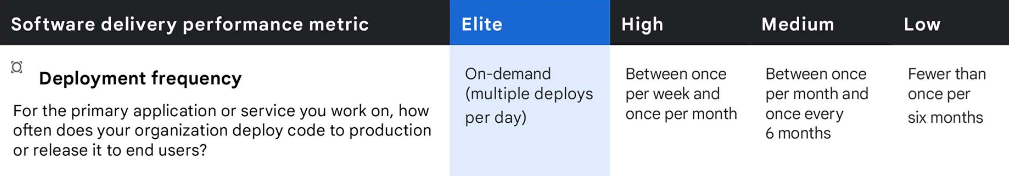
We can also review our deployment rate breakdown by day, week and month, and gauge where we stand according to the delivery performance metric from the DORA report:
By integrating Harness with Jellyfish to automate Deployment Frequency reporting, we no longer need to perform any manual checks to count how many deployments we had in a month. Having more accurate data on both types of deployments (successes versus. failures) also gave us a better insight into deployment trends and efficiency. This Deployment Frequency data will serve as a basis to measuring Change Failure Rate —the main objective that started this project—to improve the overall quality of product delivery of our engineering org in the long run. Jellyfish helped us streamline and visualize the process, and, at Iterable, we plan to continue utilizing it for the rest of the DORA metrics.
To learn more about Iterable’s capabilities, schedule a demo today.